
New statistics are available at Internet in Numbers 2021
“The Internet (or Internet) is the global system of interconnected computer networks that uses the Internet protocol suite (TCP/IP) to communicate between networks and devices. It is a network of networks that consists of private, public, academic, business, and government networks of local to global scope, linked by a broad array of electronic, wireless, and optical networking technologies. The internet carries a vast range of information resources and services, such as the inter-linked hypertext documents and applications of the World Wide Web (WWW), electronic mail, telephony, and file sharing.” — Wikipedia.
Every year the internet grows vastly in the number of users, servers, websites, e-mail addresses, web applications, social networks, and the web traffic generated between them. Here are some internet statistics as of Q3 2020*.
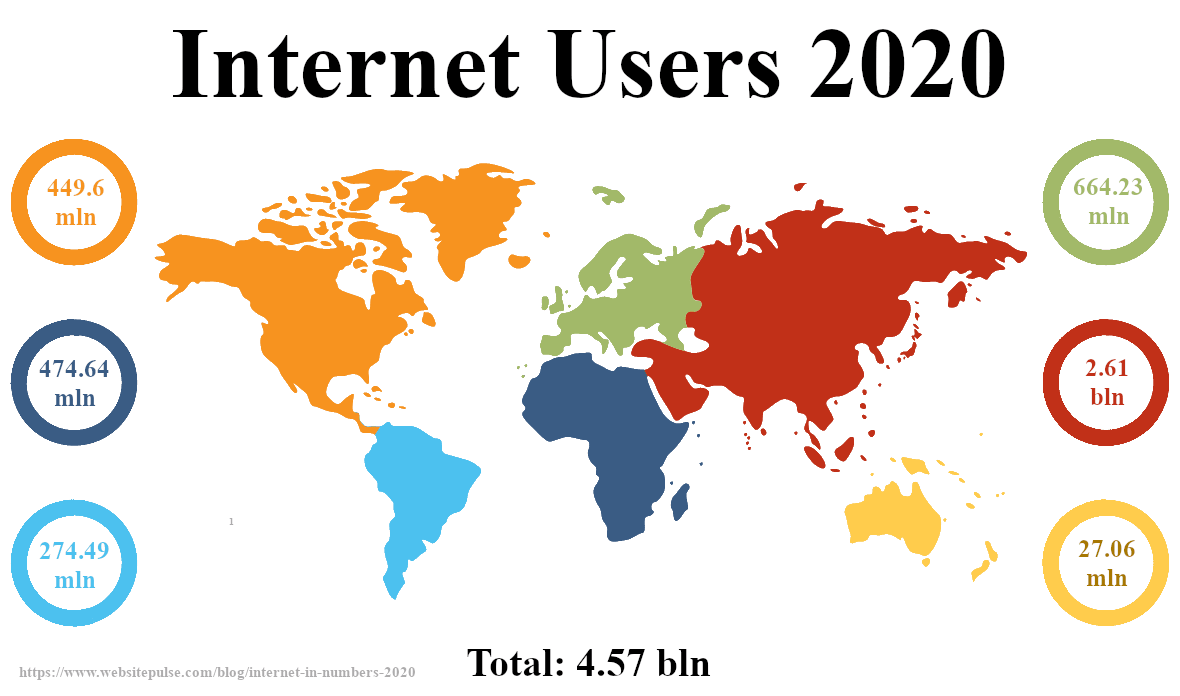
Internet users in 20201
- Number of internet users in Asia — 2.61 billon
- Number of internet users in North America — 398.01 million
- Number of internet users in Central America & Caribbean — 51.59 million
- Number of internet users in South America — 274.49 million
- Number of internet users in Europe — 664.23 million
- Number of internet users in Africa — 474.64 million
- Number of internet users in Australia & Oceania — 27.06 million
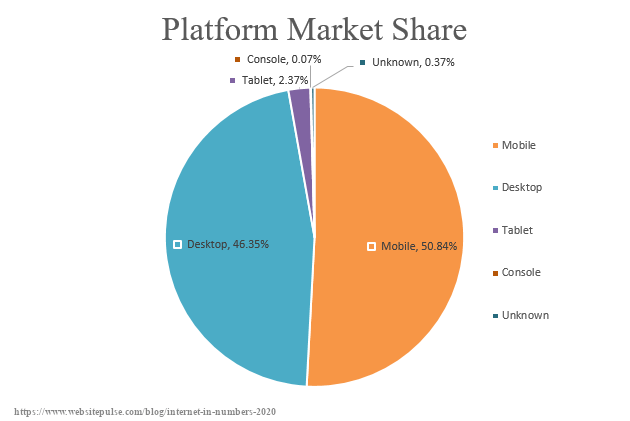
Internet Usage Device Share 20202
- Mobile users — 50.84%
- Desktop users — 46.35%
- Tablet users — 2.37%
- Console users — 0.07%
- Unknown — 0.37%
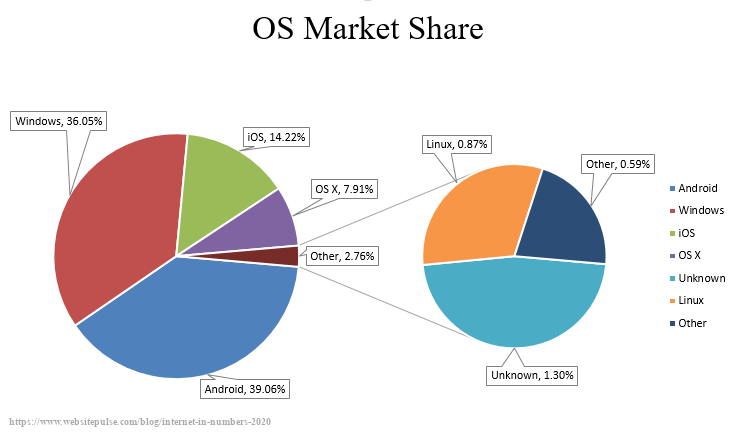
Internet Users OS market share 20203
- Android — 39.06%
- Windows — 36.05%
- iOS — 14.22%
- OS X — 7.91%
- Unknown — 1.30%
- Linux — 0.87%
- Other — 0.59%
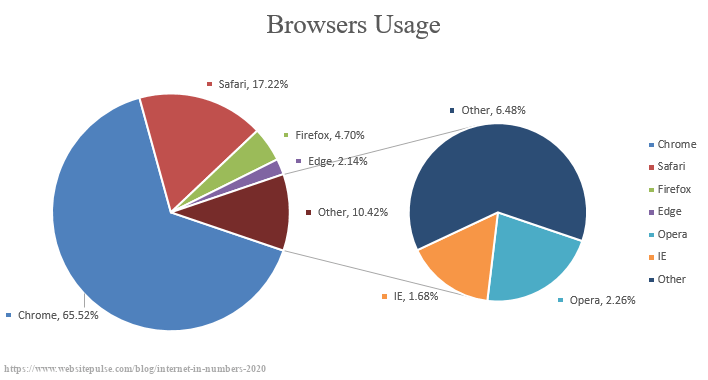
Browsers usage share 20204
- Chrome — 65.52%
- Safari — 17.22%
- Firefox — 4.70%
- Edge — 2.14%
- Opera — 2.26%
- Internet Explorer — 1.68%
- Other — 6.48%
Search Engine Usage 20205
- Google — 92.17%
- Bing — 2.78%
- Yahoo — 1.60%
- Yandex — 1.29%
- Baidu — 0.92%
- DuckDuckGo — 0.50%
- Other — 0.74%
IP addresses by Country 2020 — Top 20206
- USA — 1.578 billion
- China — 344 million
- Japan — 195 million
- Germany — 131 million
- U.K. — 117 million
- Korea (Republic of) — 113 million
- Brazil — 88 million
- France — 82 million
- Canada — 70 million
- Australia — 67 million
- Italy — 56 million
- Netherlands — 52 million
- Russian Federation — 45 million
- India — 44 million
- Taiwan — 36 million
- Spain — 34 million
- Mexico — 29 million
- Sweden — 28 million
- South Africa — 27 million
- Egypt — 24 million
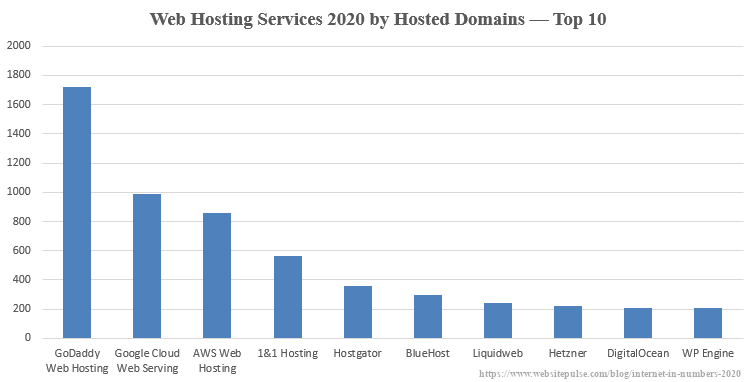
Web Hosting Market Share 2020 — Top 107
- GoDaddy Web Hosting — 16.95% / 1720 K hosted domains
- Google Cloud Web Serving — 9.73% / 987 K hosted domains
- AWS Web Hosting — 8.47% / 859 K hosted domains
- 1&1 Hosting — 5.56% / 563 K hosted domains
- Hostgator — 3.52% / 357 K hosted domains
- BlueHost — 2.91% / 295 K hosted domains
- Liquidweb — 2.42% / 245 K hosted domains
- Hetzner — 2.21% / 224 K hosted domains
- DigitalOcean — 2.06% / 209 K hosted domains
- WP Engine — 2.06% / 208 K hosted domains
- Other — 44.11%
Top 20 TLDs 20208
- .com — 149.8 million
- .tk — 25.1 million
- .cn — 15.5 million
- .de — 14.9 million
- .net — 13.3 million
- .org — 10.3 million
- .uk — 10.3 million
- .nl — 5.3 million
- .icu — 5.2 million
- .ru — 4.8 million
- .ga — 4.6 million
- .cf — 4.2 million
- .info — 4.2 million
- .ml — 3.8 million
- .br — 3.7 million
- .fr — 3.5 million
- .eu — 3.5 million
- .gq — 3.4 million
- .it — 2.9 million
- .au — 2.9 million
Website Building Platform Share 20209
- Total number of live websites — 1.79 billion
- No CMS — 39.40%
- WordPress — 38.50%
- Shopify — 3.00%
- Joomla — 2.30%
- Drupal — 1.50%
- Wix — 1.50%
- Squarespace — 1.40%
- Bitrix — 1.00%
- Blogger — 1.00%
- Magento — 0.70%
- OpenCart — 0.60%
- PrestaShop — 0.50%
- Other — 8.60%
Number of websites build on given CMS 202010
- Total number of websites built on CMS — 55.7 million
- WordPress — 27 million
- WIX — 3.8 million
- Squarespace — 2.34 million
- Joomla — 1.62 million
Global market share of cloud infrastructure services 202011
- Amazon Web Services — 33%
- Microsoft — 18%
- Google — 9%
- Other — 40%
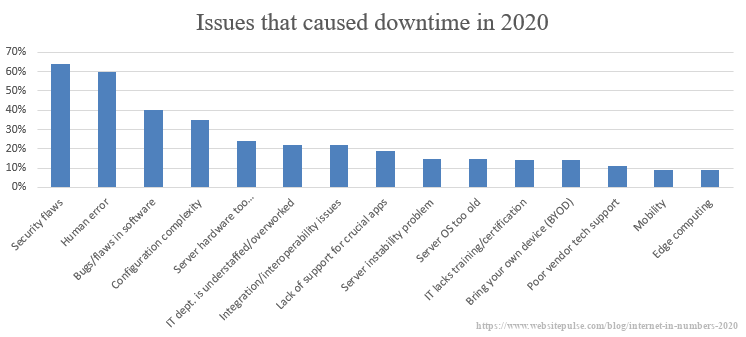
Most Common Issues that caused downtime in 202012
- Security flaws — 64%
- Human error — 60%
- Bugs/flaws in software — 40%
- Configuration complexity — 35%
- Server hardware too old/inadequate — 24%
- I.T. dept. is understaffed/overworked — 22%
- Integration/interoperability issues — 22%
- Lack of support for crucial apps — 19%
- Server instability problem — 15%
- Server O.S. too old — 15%
- I.T. lacks training/certification — 14%
- Bring your own device (BYOD) — 14%
- Poor vendor tech support — 11%
- Mobility — 9%
- Edge computing — 9%
Pro tip:
Use a third-party uptime monitoring service to get alerted first when your network, server, or website is down to minimize your costs.
E-mails 202013,14,15
- Total e-mail users — 4.037 billion
- Total sent/received e-mails — 306.4 billion
- Spam of total e-mail traffic — 53.95%
E-mail spam by country 202016
- Russia — 20.74%
- USA — 9.64%
- Germany — 9.41%
- France — 6.29%
- China — 5.22%
- Brazil — 3.56%
- Netherlands — 3.38%
- Vietnam — 2.55%
- Spain — 2.34%
- Poland — 2.21%
- Other — 34.66%
Messaging apps users per month 202017
- WhatsApp — 2 billion
- Facebook Messenger — 1.3 billion
- WeChat — 1.203 billion
- Q.Q. — 694 million
- Telegram — 400 million
- Snapchat — 398 million
Social Media Market Share 202018
- Facebook — 74.17%
- Pinterest — 11.68%
- Twitter — 6.78%
- YouTube — 4.86%
- Instagram — 1.35%
- Other — 1.16%
Social Media Active Visitors per Month 202019
- Facebook — 2.603 billion
- YouTube — 2 billion
- Instagram — 1.082 billion
- TikTok — 800 million
- Sina Weibo — 550 million
- Qzone — 517 million
- Reddit — 430 million
- Kuaishou — 400 million
- Snapchat — 398 million
- Pinterest — 367 million
- Twitter — 326 million
- Total users 20 — 3.96 billion
*The exact numbers keep changing every second.
| 1Statista | 2Statcounter | 3Statcounter |
| 4Statista | 5Digital Information World | 6Domain Tools |
| 7Datanyze | 8Domain Tools | 9W3Techs |
| 10BuilthWith | 11Statista | 12Statista |
| 13Statista | 14Statista | 15Statista |
| 16Statista | 17Statista | 18Statcounter |
| 19Statista |


 Copyright 2000-2025, WebSitePulse. All rights reserved.