An Overview
Collecting monitoring data is a significant part of our business but showing and providing this data in an easy-to-understand way is just as important to us and to our customers. We have many different levels of monitoring and thus a variety of reports clients can choose from. As our company is customer-driven, we have created more than 100 different reports that can fulfill all of our clients’ requirements.
Here I will review the Reports section of the control panel so you can easily identify which reports or sub sections you need to go to when using our services.
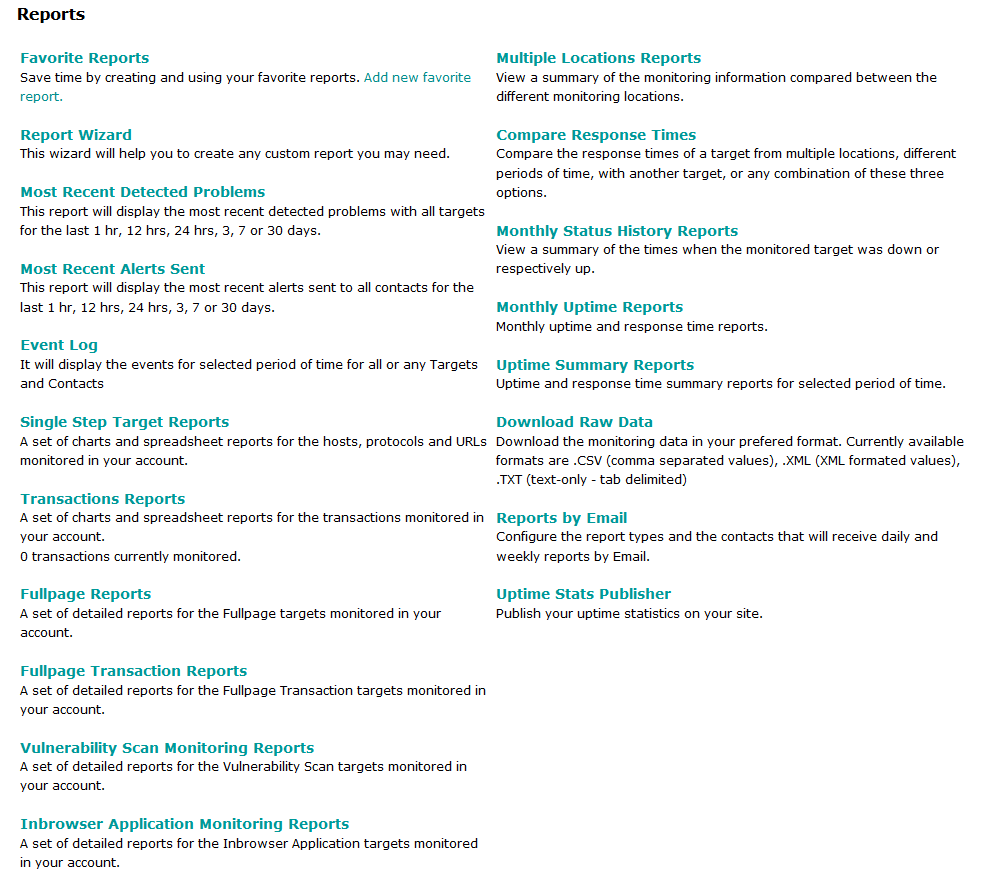
By clicking on the Reports button on the top menu you will enter the Reports section:

When generating a report here, you will have the option to add it to your favorite reports and if you do so, you can easily find it in the Favorite reports sub section. A list of all saved favorite reports will appear. This is a very useful feature if you generate the same report every single day, for example.
If you are not sure exactly what report you need to generate, you can try out our Report Wizard. Just choose the report type (Uptime statistics, Logs and summaries, Multiple locations reports, Status history) first. Then pick up the target and choose the visualization method, along with locations, date period, etc.
If you have just received an alert and need to quickly check the details, you can review Recently Detected Problems and Alerts sub sections. You have an option to also select different report periods ranging from 1 hour to 30 days.
To see all detected events and all sent alerts for a specific target or period, you can use the Event Log Wizard. Here you can generate a report for all events in your account for a day, two days or a week. You can also choose to see only the targets for which we recorded status changes and sent alerts.
In the Single Step Target Reports section you can generate reports for targets that use our basic, advanced and performance level of monitoring. You can generate daily logs, daily status summaries, weekly logs, weekly error reports, monthly logs, etc. There are different visualization methods including extended charts.
If you are using our performance transaction or custom script levels of monitoring, you can generate all sorts of reports for these types of targets in the Transactions Reports subsection.
The Fullpage Reports subsection lets you generate reports for your full-page targets. The Fullpage Transaction Reports section is thus used to create full-page transactions.
The Vulnerability Scan Report section lets you generate reports for your vulnerability targets and shows you details regarding the possible exploits and security risks to your servers.
If you are using our In-browser level of monitoring, you can generate the reports form the In-browser Application Monitoring Reports subsection.
Since a lot of our customers want to compare data from different locations, we have created the Multiple Locations Reports subsection that will show you the data for all locations used to monitor a specific target.
If you want to compare response times between different locations and different targets, you need to go to the Compare Response Times subsection.
The monthly status history report gives you details regarding the status changes of a specific target for a calendar month. This is very useful if you, for example, want to make sure that you keep your SLA agreements.
You can also generate Uptime Summary Reports that will show the summary data for a month, year or even a greater period of time (as long as the target has been active for so long).
If you want to download the collected data and import it into a database or an excel file, for example, you can use the Download Raw Data options.
Most of the common reports can be set to be sent automatically to one or more contacts in your account from the reports by email sub section.
If you want the collected data to be visible to your clients, you can use our Uptime Stats Publisher to create your own custom report that is accessible to everyone on the internet.
I will go into more details regarding each and every subsection of the Reports section soon.
Don't have an account yet? Start your 30 days free trial!


 Copyright 2000-2025, WebSitePulse. All rights reserved.