There are several reports that can quickly provide you with information related to the latest events of your targets.
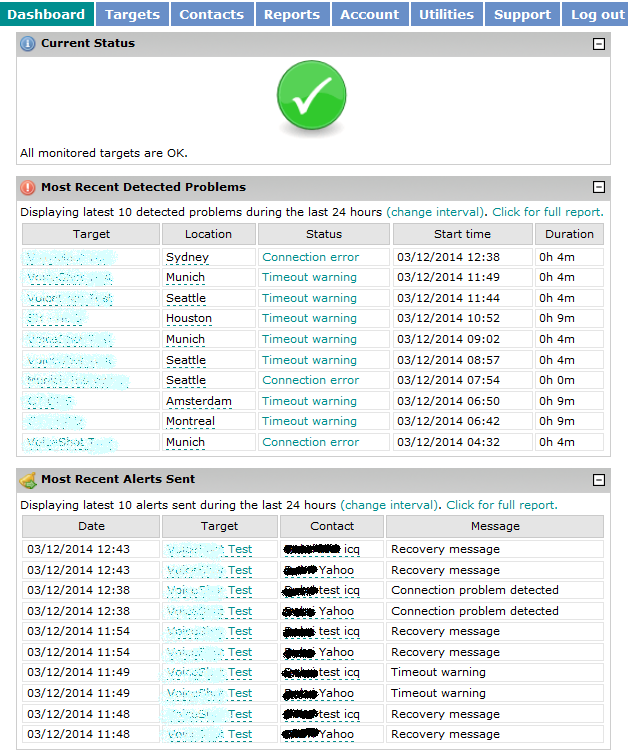
Two of the modules of your account dashboard provide information only on a limited number of events.

If the current status icon is green, it means all the active targets in your account are up right now and your sites and servers are not experiencing any problems. Red means we are detecting problems with some or all of your targets for which you will be able to see details in the Current Status module.
The next section below the Current Status section is the Most Recent detected problem. Clicking on the target label link will take you directly to the target details section for the specific target. The status link will then provide more information regarding the error/warning we've detected. You will see the detailed breakdown of the response times as well as the confirmation details from an independent secondary location. The same goes for the Most Recent Alerts Sent section where you have details regarding the notifications which our system has sent. You can change the time interval for these sections and choose from:
- 1 hour
- 12 hours
- 24 hours
- 3 days
- 7 days
If you rarely experience any problems with your targets, you might want to choose the 7-day interval, so you will be able to quickly access specific errors. The default interval is 24 hours for these specific sections.
If you want to see more than 10 events at the same time, you should click the full report link or go to Reports -> Most Recently Detected Problems, or Most Recent Alerts Sent reports. You will be able to see all the events for the specific period and not only the last 10 ones. You will also be able to choose a 30-day interval which is not available for the dashboard modules.
You can download the data in several formats:

This is a useful feature should you need to analyze this information later.
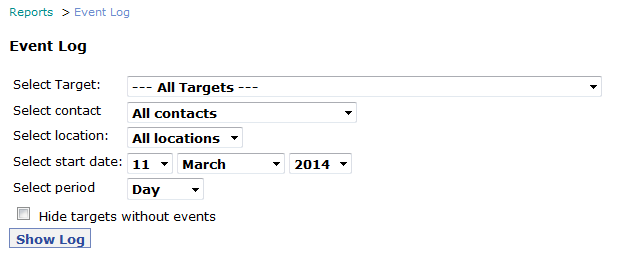
To get a more detailed report and filter out only a specific target or contact, go to Reports -> Event Log.

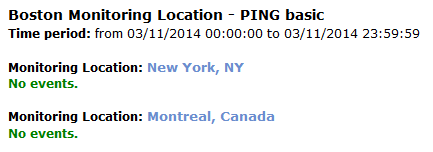
Clicking the Show Log button without making a custom selection will get you a list of all targets and locations, and if we have not detected any events, the data will be in green:

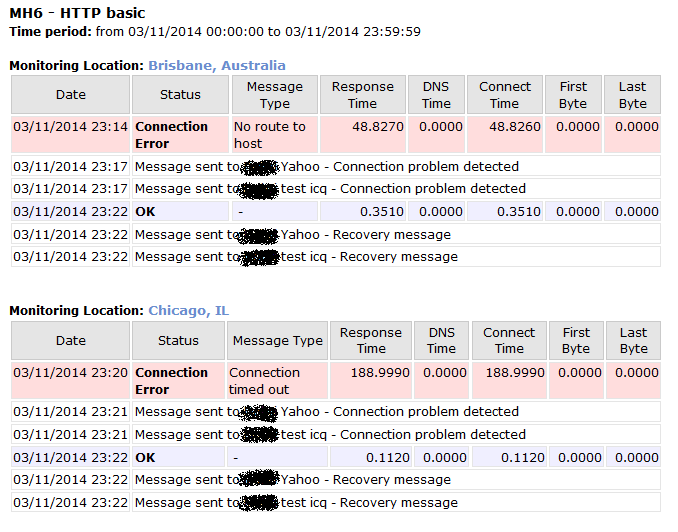
If, on the other hand, we have detected any problems for a specific target, you will get a more detailed report:

In case this report shows we have sent out specific alerts which you have not received, contact us immediately so we can investigate further.
If you check the Hide targets without events box before you generate the report, we will show you only the data for the targets that have experienced problems for the specific period. You can select three periods for the report:
- Day
- 2 Days
- Week
To generate a weekly report for the last week, for example, you should choose the starting date 7 days before today.
From the Select Target drop down menu, you can choose a specific target or all targets. For a specific target you can select a specific location as well. Suspended targets are also shown in this drop down menu.
You can also select a specific notification contact and get the data only for that contact. This is a very useful feature if you want to check how many alerts a specific contact has received for example.
These reports are very useful if you want to get the detailed information for a specific error or notification quickly. You can also track your usage of the paid types of notifications (SMS and voice calls) more easily.
Don't have account yet? Sign up for your free tiral!


 Copyright 2000-2025, WebSitePulse. All rights reserved.