Not long after releasing our latest and most sophisticated monitoring level – the In-Browser Application Monitoring, we are happy to announce that it is now available as a free test tool.
So here’s a brief description of what the In-Browser level of monitoring is all about:
It simulates a real user “browser-like” experience. It is based on the Firefox “GECKO” engine and supports multiple simultaneous connections, JavaScript rendering and page component caching. The benefit is that we are able to detect performance issues connected to the code itself, the images and all other third-party embedded objects.
We developed our In-Browser Application Monitoring service further and created the Browser Full Page test that you can use at any time. This is how its main page looks like:
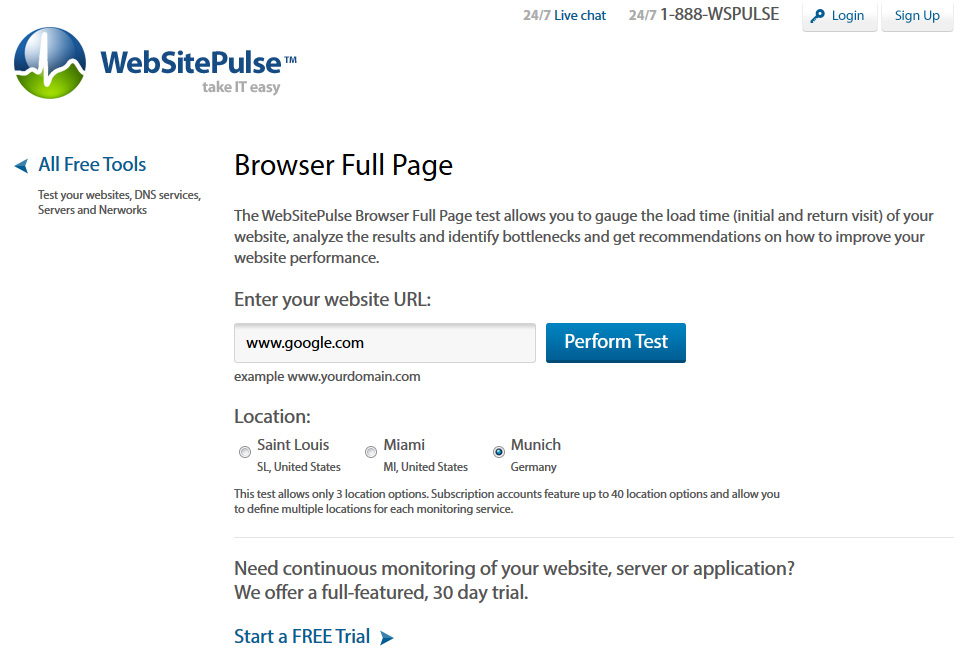
To test a website URL, simply enter it in the field, click the Perform Test button and a loading animation will pop up.
After the test is completed, a result screen will be provided:
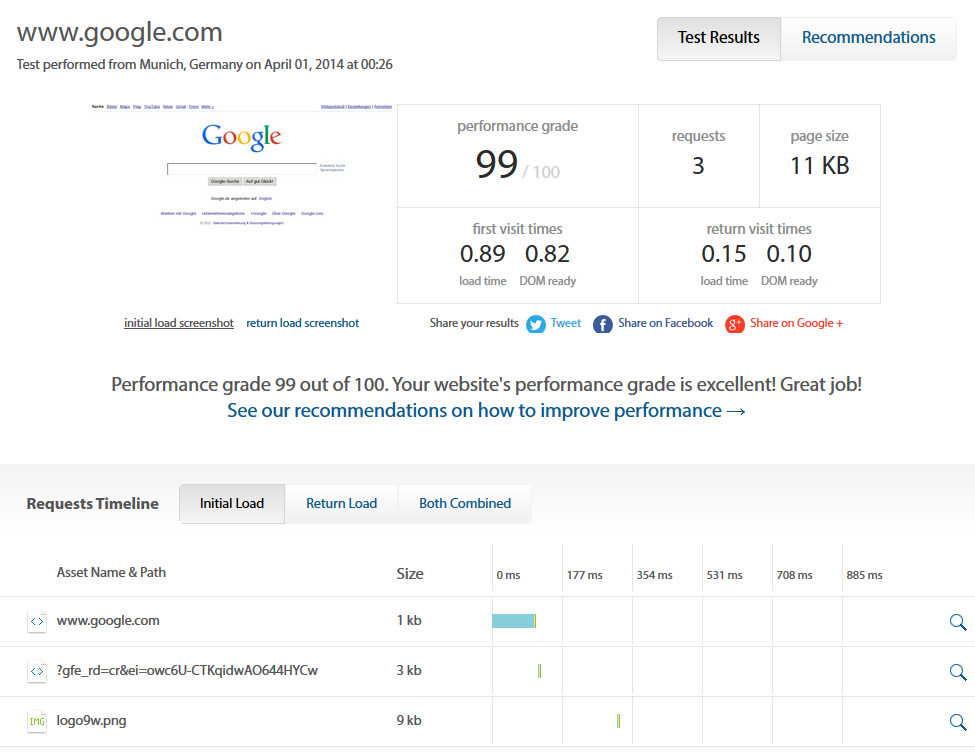
The tested URL and a timestamp of the test are the first things to appear on the page. An initial load screenshot is then provided as well as an option to see what the return load screenshot looks like. This is one of the unique features of the Browser Full Page test. It is initially simulating a first-time user experience and, immediately after that, a second test is performed to simulate a repeated user experience. Screenshots are then made and the collected data is reported.
Next is the WebSitePulse performance grade score that, in this case, is almost perfect – 99/100. Congratulations, Google! An information about the number of requests made and the total page size can be seen next to the score itself. First and return visit times are also displayed below.
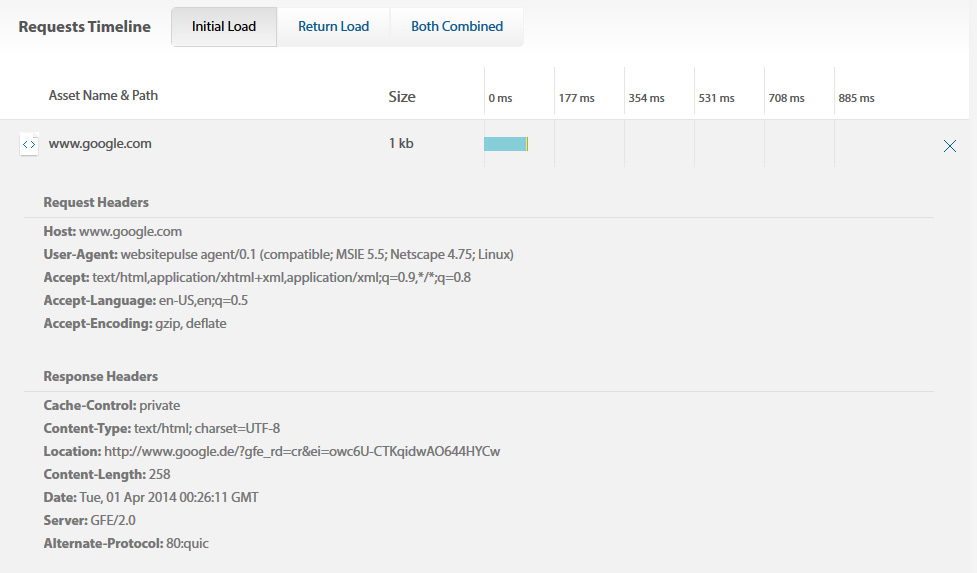
Switching our attention to the Request Timeline below, we will notice a breakdown of all page components (3 in this case) and how long it took to load them on both the initial and return load tests. You can easily navigate through the timeline by clicking the Initial Load, Return Load and Both Combined buttons on top of the chart. Clicking the magnifying glass icons on the right will reveal the request and response headers for the selected element.
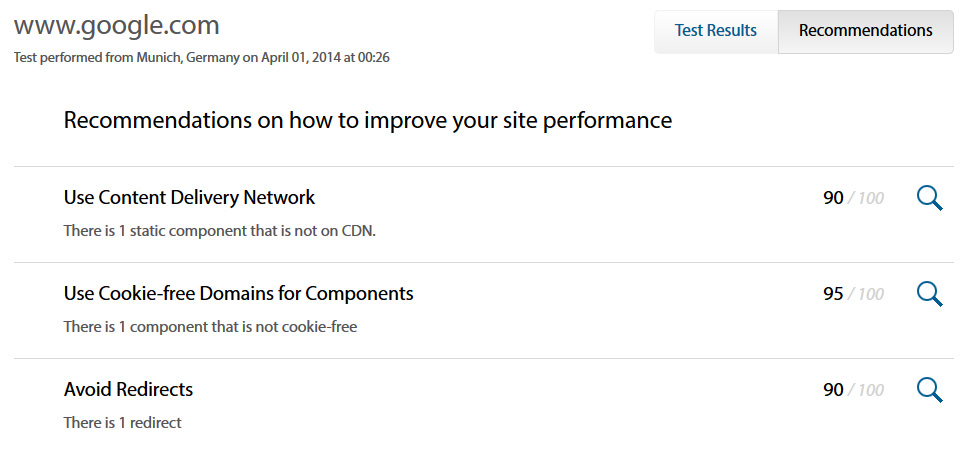
Switching to the recommendations screen is easy - simply click the Recommendations button. Having mentioned that Google.com performed pretty well on our test, we can still hint improvements for its performance and responsiveness. Here is what we have to say for that one:
You can also Tweet and share your results on Facebook or Google+. Or, if you still do not have an account with us, you can click the Start a FREE Trial button and set your site up for monitoring. You will get all of the functionality described above, plus tons more like several different types of alerts, takeover feature, 24/7 e-mail, chat and phone support, 40 locations around the world etc.
So, what is your WebSitePulse score?


 Copyright 2000-2025, WebSitePulse. All rights reserved.